| basics |
Grapher
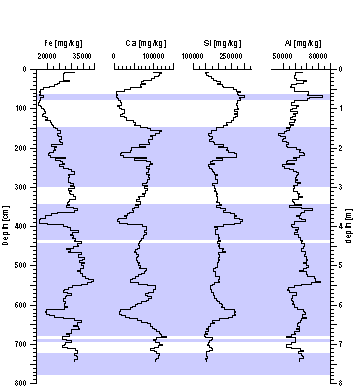
® allows creating step plots, that can be used as an easy way to create
to overlay zones (OIS, turbidites, etc.) over downhole plots. You
just have to create a worksheet with the top and bases of layers
you want shaded marked by a 0 for the base of a layer and a fixed
number for the top. |
| example
graph |
 |
example
worksheet
containing the
data for the
blue shading
|
| depth
cm |
start
(10) end(0) |
description |
| 0 |
0 |
top of
core |
| 60 |
10 |
top of
first turbidite |
| 79 |
0 |
base of
first turbidite |
| 144 |
10 |
top of
second turbidite |
| 300 |
0 |
base of
second turbidite |
| ... |
... |
... |
|
| conditions |
in
Grapher 4:
create a "zones" x-axis with minimum 0 and maximum 10
place this axis in your plot so it covers the range that you want
shaded zones
make the axis invisible by setting the line width to 0,
if necessary set line color to white
for this axis uncheck the show tick marks and show tick mark labels
use your your normal depth axis (y-axis)
add a step plot to your graph (graph - add to graph - step plot
....)
set the start/end column as x-data source and the depth as y-data
in the same tab check: steplines: start lines horizontally
in the Line-Fill tab:
Line properties: set the line witdth to very thin or to 0mm and
the line color to white
Fill properties: select a fill pattern, fill color, direction/cutoff:
down
|
| tipps |
You
should consider using Strater®
to create downhole plots |
